해본 적이 없어서, 귀찮아서, 무엇을 좋아하는지 잘 몰라서 취미를 찾지 못했다면 이미지 문답을 따라가 보세요. 활동성, 혼자/함께, 실내/야외, 창작, 배움, 탐험 성향을 바탕으로 잘 맞을 가능성이 높은 취미를 찾아드립니다.
X, Facebook, Instagram을 사용하는 과정에서 나타날 수 있는 관계 밀도, 비교 피로, 반응 의존, 표현 욕구의 변화를 가상으로 실험해보세요. 이 시뮬레이터는 실제 개인을 진단하지 않으며, SNS 행동 패턴을 이해하기 위한 교육용 모델입니다.
Overview
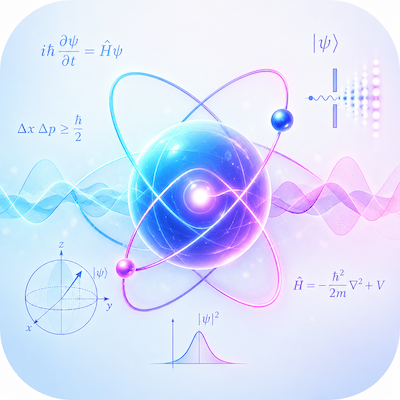
Physics Simulator is an interactive educational mini app that helps users explore fundamental physics concepts through real-time visual simulations.
Content
Adjust variables such as gravity, velocity, angle, and mass to observe how they affect an object's motion. Experiment with different settings and visually understand projectile motion and the physical principles behind it.


Overview
A browser-based visualization of the downstream consequences of Himalayan glacial retreat. Structured as a vertical narrative, the page combines live Canvas simulations, an interactive projection chart, a watershed map, and a timeline — all in a single file. The Himalayas supply dry-season river flow to over 2.4 billion people across South and Central Asia. At current warming rates, the region is losing glacier volume twice as fast as before 2000, triggering hazards that range from sudden outburst floods to the long-term collapse of freshwater supply.
Sections
Hero — Animated Himalayan cross-section at night, with glacial meltwater particles flowing down to a river at the base. Key statistics: 46% glacier volume lost since 1970, 2.4B people at risk, regional warming 0.7°C above the global average.
Impact Scenarios — Four live simulations: a moraine dam filling and bursting (GLOF), a flood plain inundation cycle, a drying river channel illustrating freshwater collapse, and a coastline showing incremental sea-level rise submerging deltaic cities.
Glacier Volume Chart — Year slider from 1950 to 2100 plotting three IPCC scenarios (RCP 2.6 / 4.5 / 8.5). Even the optimistic pathway eliminates two-thirds of remaining ice by 2100.
Affected Regions — Six country cards (Pakistan, India, Bangladesh, Nepal, Bhutan, SW China) with at-risk population, hazard description, and severity bar.
Watershed Map — Himalayan glacier sources, the Indus, Ganges, and Brahmaputra river systems with animated flow pulses, and downstream cities color-coded by risk level.
Timeline — Six milestones from present to 2100: accelerating retreat, GLOF peak, peak water threshold, agricultural deficit, freshwater crisis, and irreversible hydrological transformation.
Data Table — Six river basins with projected peak flow increase, post-2060 flow reduction, GLOF risk classification, and severity rating under RCP 4.5.
Disaster & Collision Simulator — Overview
A browser-based, single-file interactive visualization suite covering six categories of physical disaster and collision events. Each simulation runs as a real-time Canvas animation with adjustable parameters, live data readouts, and physics-informed behavior — no dependencies beyond the fonts.
Simulations
🌍 Seismic Wave
Models the propagation of P-waves (primary, compressional) and S-waves (secondary, shear) radiating from a user-placed epicenter. Surface structures respond dynamically to ground motion — buildings accumulate stress, lean, and eventually collapse as shaking intensity exceeds their structural capacity. An embedded seismograph panel plots ground displacement in real time, replicating the output of a broadband seismometer.
🌊 Tsunami
Simulates a shallow-water bore surge making landfall after a submarine seismic event. Wave shoaling compresses and amplifies the wave front as it transitions from deep ocean to the continental shelf. Floating debris objects respond to hydrodynamic drag and inundation depth, illustrating the destructive load-carrying capacity of the surge beyond the initial wave impact.
☄️ Meteor Impact
Renders a hypervelocity atmospheric entry and ground impact. The impactor follows a ballistic trajectory with a thermal trail, vaporizing on contact and excavating a crater scaled to diameter, velocity, and material density. Concentric shock rings propagate outward from the impact point, and ejecta particles follow ballistic arcs under gravity, replicating the mechanics documented in impact cratering studies.
🔥 Wildfire Spread
Implements a stochastic cellular automaton on a grid of fuel cells, where ignition probability for each cell is computed from neighbor fire state, wind vector alignment, and fuel moisture content — directly reflecting the Rothermel fire behavior model. Wind direction and magnitude are adjustable in real time, and new ignition points can be placed interactively to study fire front interaction and spotting behavior.
🏗️ Building Collapse
Demonstrates progressive structural failure initiated at a user-defined weak floor. Once the failure floor loses integrity, gravitational load redistributes upward through the remaining structure, triggering a cascading collapse sequence floor by floor. Debris accumulates at ground level with restitution physics, modeling the pancake-collapse mechanism observed in seismically damaged reinforced-concrete structures.
🚗 Vehicle Crash
Applies conservation of momentum to a configurable two-vehicle head-on collision. Crumple zone deformation is proportional to closing speed and mass ratio, extending the collision duration to reduce peak deceleration force — the core principle of modern passive safety design. Delta-V (change in velocity) is computed and displayed as the primary injury-severity indicator, consistent with real-world crash reconstruction methodology.
The Scientific Calculator offers three keypad modes — Main for everyday math including powers, roots, and factorials; Trig & Log for the full suite of trigonometric and hyperbolic functions; and Stats for dataset analysis like mean, standard deviation, and combinatorics.
On the right panel, 12 physical constants (speed of light, Planck, Avogadro, etc.) can be clicked directly into your expression, and a real-time unit converter handles 12 categories from length and temperature to data storage. A separate Graph mode lets you plot any f(x) expression with adjustable axes. Calculation history saves the last 20 results, and memory buttons (MS/MR/MC) let you store values between calculations. Output can be switched between decimal, scientific, and engineering notation, and the entire calculator is fully keyboard-operable.